PAPER TITLE : Egg Production and behaviour changes in laying hens in response to diets containing coconut by-products
NAME OF AUTHOR : Shantanu Panigrahi
AFFILIATION : Union of Petrol Station Workers
ADDRESS : 3 Hoath Lane, Wigmore, Near Gillingham, Kent ME8 0SL, United Kingdom.
RUNNING TITLE : Dietary copra and laying hen performance
CORRESPONDING AUTHOR AND ADDRESS : Shantanu Panigrahi, 3 Hoath Lane, Wigmore, Near Gillingham, Kent ME8 0SL, United Kingdom .
Email address: shantanupanigrahi@yahoo.co.uk
ABSTRACT.
1. The variability in the nutritive value of copra meal from different sources for egg production and its correlation with certain features of laying hen behaviour were examined in a two-phased feeding trial. The experimental diets, which were balanced for proximate composition, were supplemented with synthetic lysine and methionine for the second phase and compared with a standard non-copra control diet.
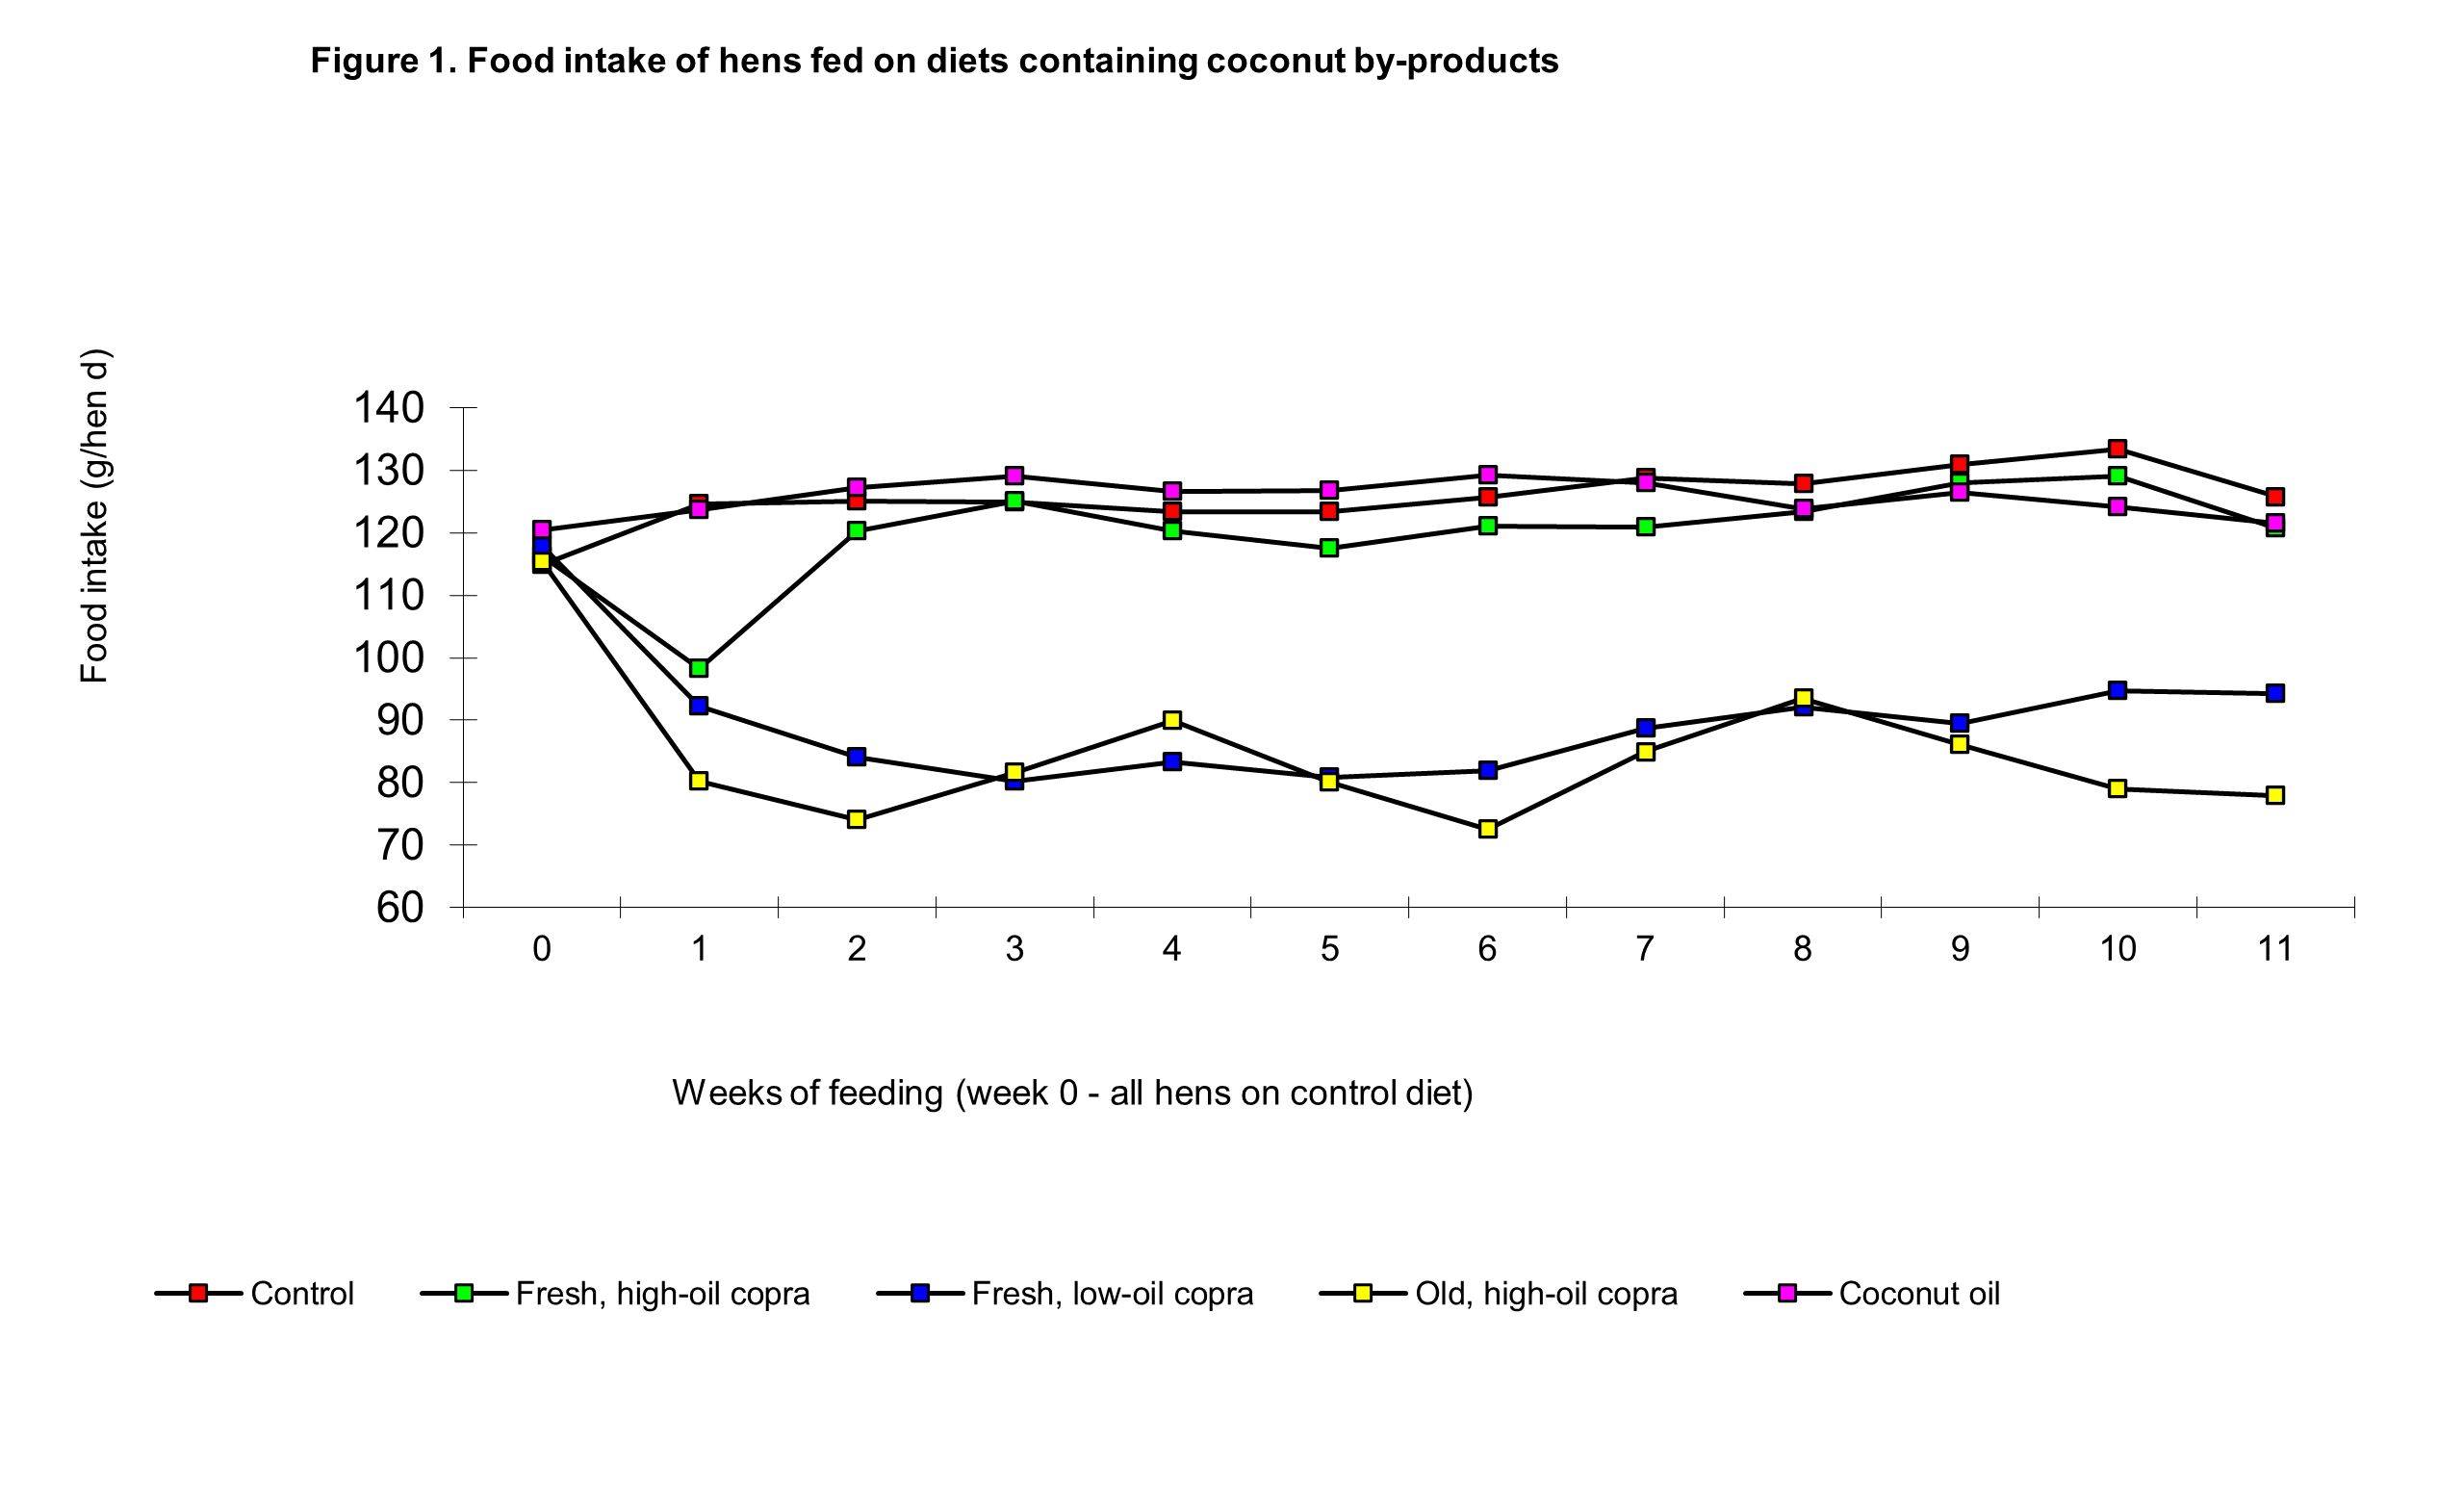
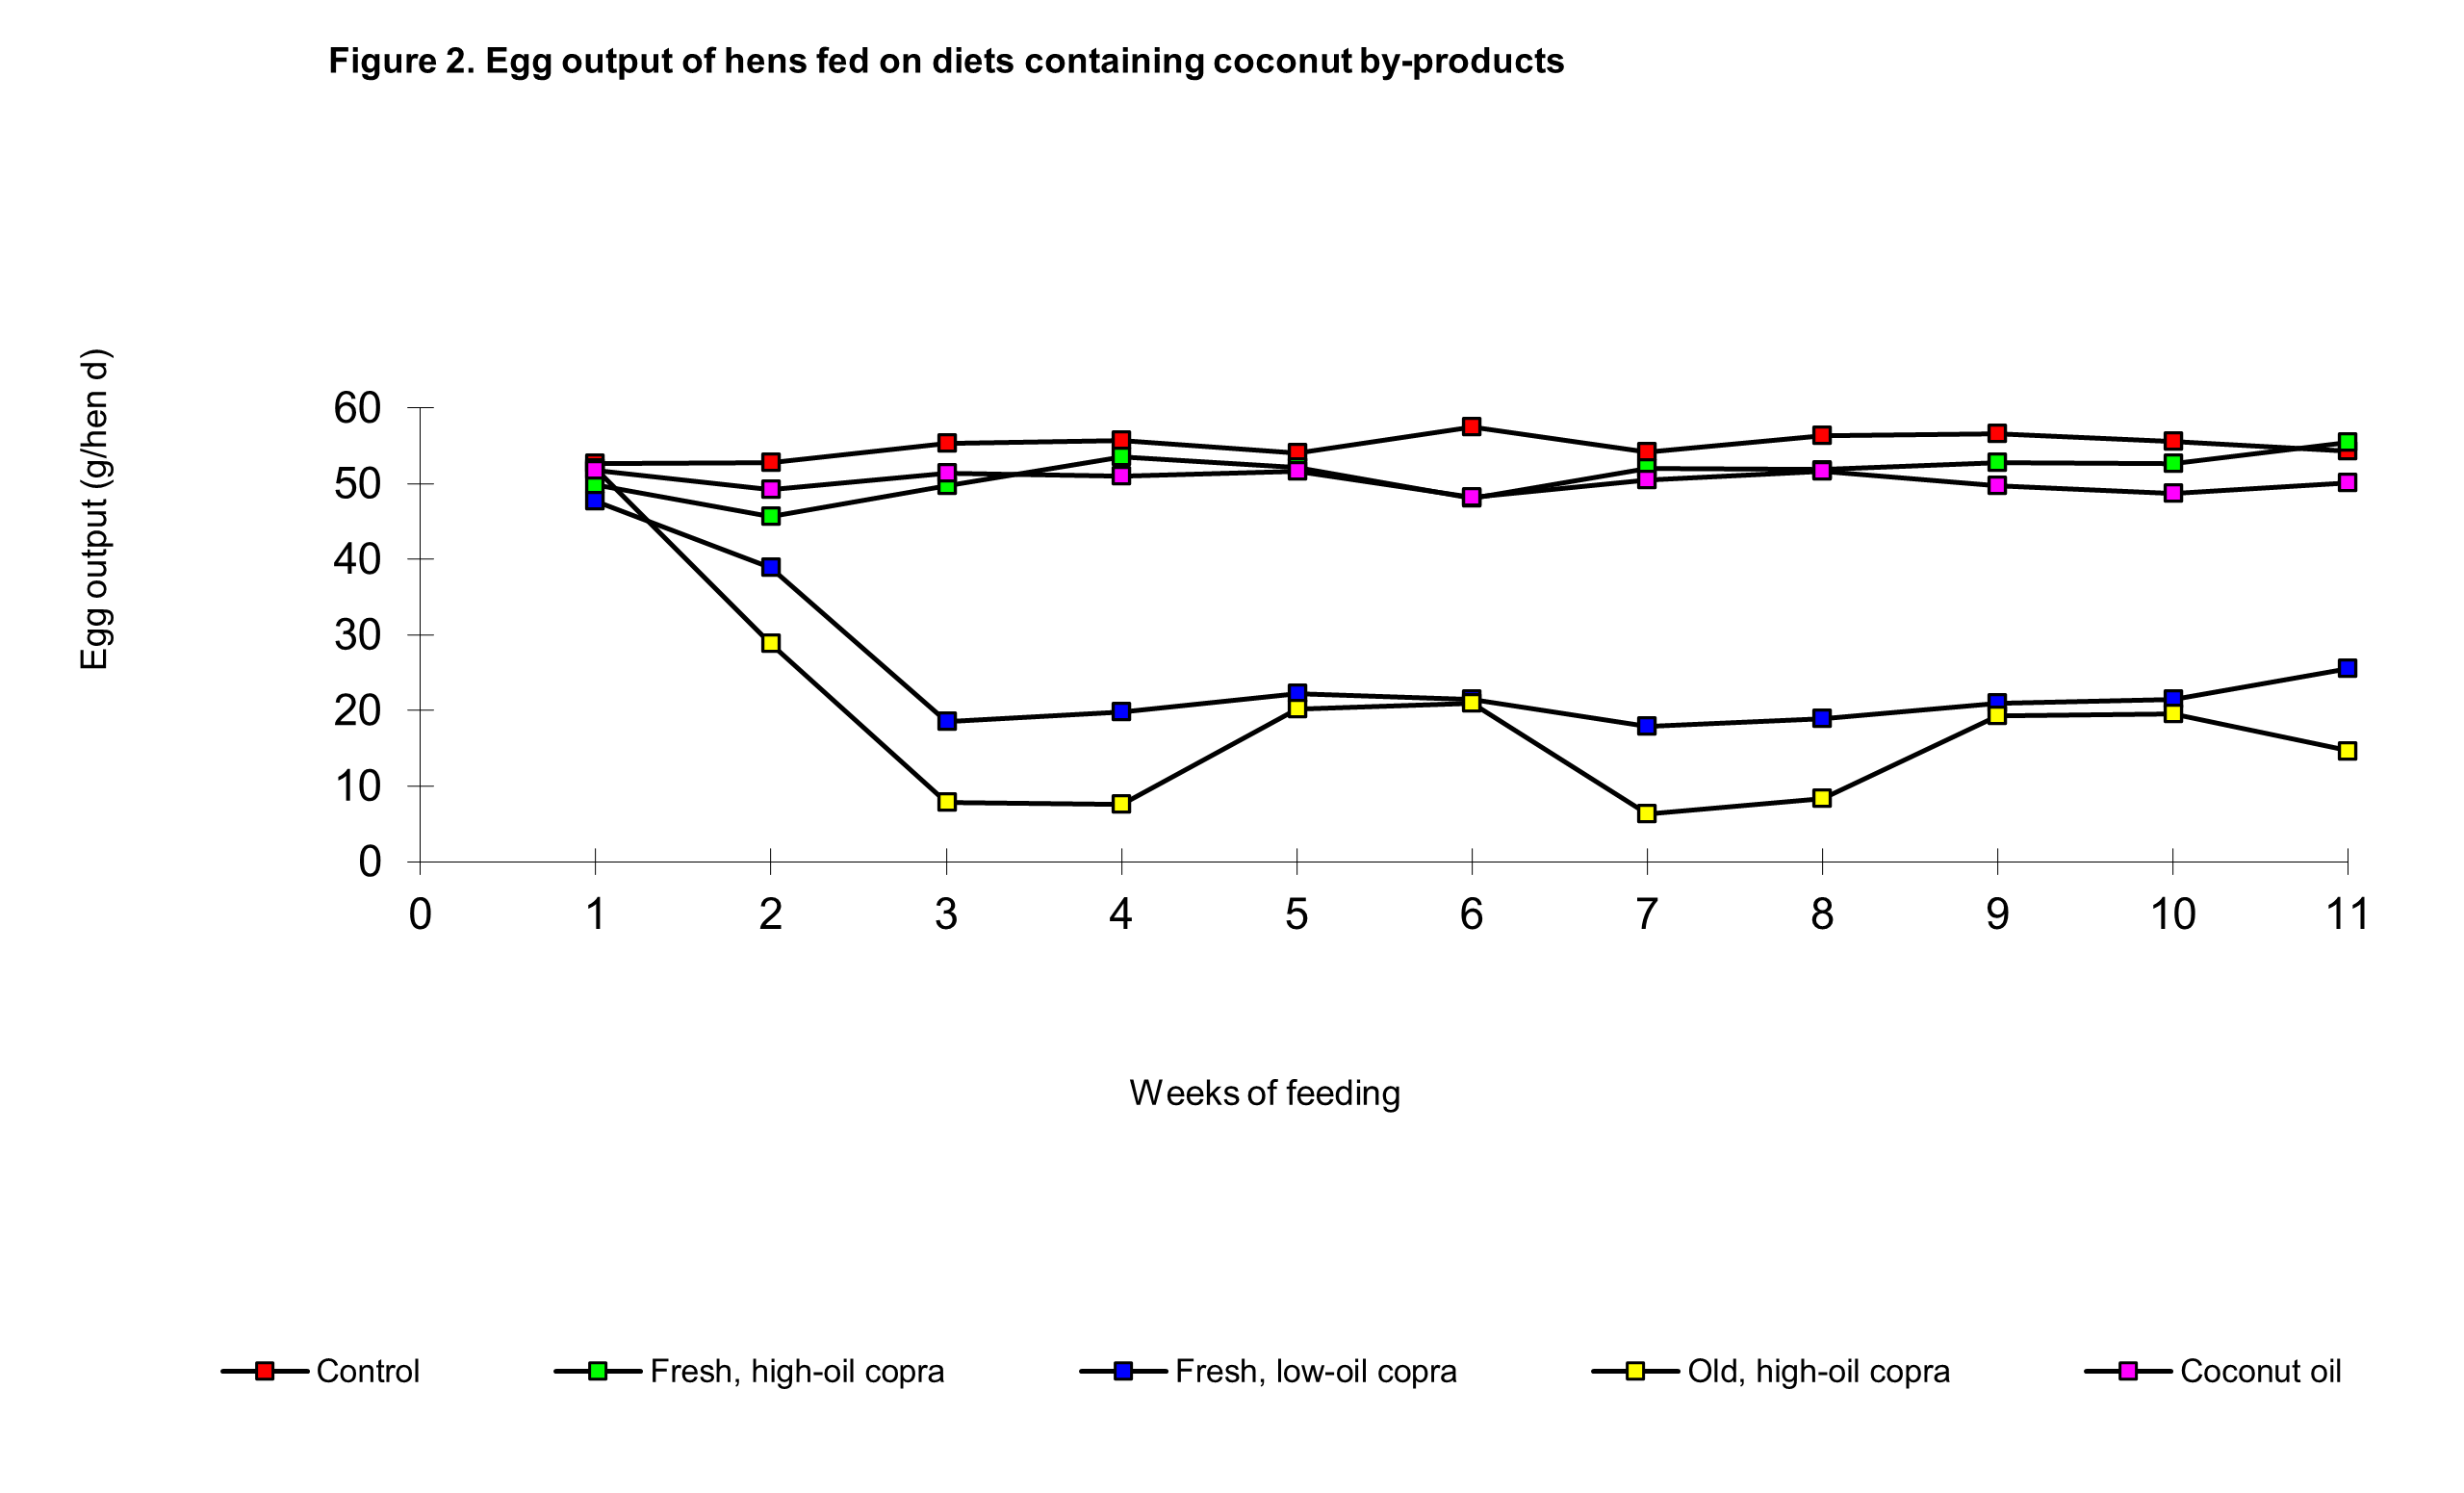
2. A freshly-expelled high-oil copra produced from single pressing of a small-scale screw-press expeller and containing 220 g residual lipid/kg gave a satisfactory level of egg production when included in the diet at 400 g/kg; production was not significantly different from control between 7-11 weeks of feeding and reached the control diet level by week 11.
3. A single-pressed copra meal from a commercial expeller containing 75 g residual lipid/kg produced a more than 50 per cent lower egg output than the 220 g residual lipid/kg copra meal.
4. Incorporating coconut oil at 100 g/kg produced a similar food intake to that of controls but a slightly lower egg output, which was not significantly different from the fresh high-oil copra group.
5. Retesting a high residual lipid copra meal after storage for 34 months produced a considerably lower food intake and egg production than previously. Although the dietary fat, consisting mainly of coconut oil, contained a very high concentration of free fatty acids, this did not appear to be the cause of the poorer laying performace.
6. Hens fed the low-oil copra and stored high-oil copra displayed increased pecking at a novel object placed before them, and increased feeding and aversive behaviour when approached by the researcher. The behavioural response was highly significantly dependent on the diet and feeding period, and was negatively correlated with food intakes, egg output and body weight of hens.
Keywords : Coconut by-products, behaviour, egg production, hens, diets.
Introduction
Copra meal is available in considerable quantities in many tropical countries, and despite its moderate protein and energy contents, is suitable for feeding to non-ruminant livestock at high dietary concentrations. Among poultry species, while hens in production can tolerate dietary concentrations of up to 400 g copra meal/kg without serious depression of egg-laying performance (Panigrahi, 1989), it was observed that young broiler chicks initially experience difficulty in consuming sufficient food, intake being restricted by their limited gut capacity and copra's high bulk density and water absorbing property (Panigrahi et al., 1987).
A major factor in considering the use of copra meal in poultry diets is the concern over its variability in nutritive value, which has been responsible for the general reluctance of feed compounders to use the feedstuff in countries such as the Philippines, and which has consequently resulted underutilisation of this resource (Watson and Bennet, 1992). The variability in nutritive value was demonstrated in an experiment in which copra meals from different sources were fed to day-old broiler chicks (Panigrahi, 1992). The nutritive value may be influenced by agronomic factors such as the variety of coconut, age at harvest, etc) or the methods used in processing the coconuts (drying, oil extraction), both of which could affect nutrient digestibility. It is also possible that meals that are high in residual lipid content may be prone to oxidative rancidity under storage in hot and humid tropical conditions and which could therefore reduce its acceptability to poultry. A further problem with copra is that it is a suitable substrate for the growth of Aspergillus fungi that produce aflatoxins, chemical compounds that produce adverse effects on poultry health, although the concentrations at which the productivity of young broiler chickens and adult egg-laying hens might be affected from natural field contamination is another area of uncertainty.
A combination of phenotypical characeristics and nutritional and housing requirements leads to the suggestion that broiler chicks and egg-laying hens are entirely different species of birds that have been generated recently by the human-selection process of commerce. In this study therefore it was of relevance to determine whether the variability in the nutritive value of copra observed in the earlier broiler chick study was reproducible with hens at peak egg-laying performance. The experiment designed also examined the extent of deterioration in the nutritional value of a high residual lipid copra during storage.
Dietary deficiencies, excesses or certain imbalances of vital nutrients, may act as sources of physiological stress to animals to which high-nutrient demanding and intelligent species may display changes in behaviour that are adaptive in aetiology. In chicks increased feather pecking and cannibalism are known to be extreme examples of this kind of behaviour. Such responses have been reported for diets low in protein, phosphorus and fibre (Schaible et al. 1947) and arginine (Siren, 1963). Laying hens fed on a low-in-sodium diet to induce a pause in lay showed increased awareness of their environment and a tendency to peck (Hughes and Whitehead, 1979), whilst calcium-deprived birds showed increased pecking, with preferences for certain objects (Wood Gush and Kare, 1966), and an increase in spontaneous activity in terms of body movements (Hughes and Wood Gush, 1973). Ross-1 broiler chicks fed on diets containing copra meal or palm kernel meal at high dietary concentrations became inquisitive and excited when approached by the experimenter, the behaviour apparently associated with their poor food intakes, and hence growth rates, caused by unsuitable physical characteristics of these feeds, which had different physical properties (Panigrahi et al. 1987; Panigrahi, 1991). The experimental diets designed for the present study provided an ideal opportunity to examine whether laying hens also display abnormal behavioural patterns when presented with different types of copra meal in their diet.
Materials and Methods
The experiment studied the laying performance of hens presented ad libitum diets containing a freshly expelled high-oil copra cake, an old high-oil copra cake, a low-oil copra cake, and the freshly extracted coconut oil. The country of origin of the three coconuts used were different, with that of the fresh low-oil copra meal, obtained from BOCM, UK Ltd not being known. It had been processed by a single high pressure screw-press expelling process at the company to result in a meal of only 75 g residual lipid/kg. The fresh high-oil copra meal was produced in the Natural Resources Institute by oil-extraction of a copra from the Solomon islands. It was processed by a single press of moderate pressure in a Simon Roseown Mini-40 screw press expeller (at an average choke temperaure of around 90o+ o10C) to produce a meal that contained 205.0 g lipid/kg. The high-oil stored copra cake, containing 220.9 g crude fat/kg, had been obtained from an amimal feeds merchant as originating in Kenya, and had been used when freshly purchased as Copra-1 in an earlier study where at the 400 g/kg dietery inclusion rate egg output of laying hens over a 10 week feeding period was found to be only 6 per cent lower than that resulting from a non-copra control diet, as reported in Panigrahi (1989). The copra cake had been kept in coir bags inside a metal building (aircraft hanger) during the 34 months between that feeding trial and the present one, and had been exposed to high summer temperatures of around 30oC with accompanying high humidity for a few weeks. The proximate composition of the meals are shown in Table 1.
The three copra meals were incorporated in the diet at 400 g/kg, using values of apparent metabolisable energy generated using the equation of Lodhi et al. (1976) with the assumption that their available carbohydrate content was 0.85*the nitrogen-free extractives for each meal. In order to determine whether the coconut oil (obtained from fresh extraction of the Solomon Islands copra) may contain factors that would would be detrimental to food intake, it was included at 100 g/kg in a separate dietary treatment. The laying performances of these four groups of hens were compared with that resulting from a non-copra control diet that was based on maize, soyabean and fishmeal. The composition of the five diets and chemical analyses are shown in Table 2, with amino acid analysis being carried out using a Biotronik LC5000 analyser. After 6 weeks of feeding (Phase 1), all diets except the control diet were supplemented with synthetic lysine at 3 g/kg and methionine at 3 g/kg for Phase 2 of the experiment which lasted a further 5 weeks, in order to evaluate where the performance reductions that were being observed could be attributed to dietary deficiencies of these amino acids.
Point-of-lay, Shaver Strarcross Brown pullets were housed individually in battery cages that were arranged in 2 blocks of two tiers, each cage supplied with its own feed hopper and nipple water drinker in a brick and concrete construction controlled-environment experimental room. The room was equipped with an air-circulation and ventillation system that recylced the air 18 times per hour. The experimenter and cleaner only entered the from one of the doors, the other one being there for fire escape regulations. The cages were numbered 1-80, each tier being 20 cages long occupying roughly 90 per cent of the length of the fully-enclosed (apart from the two doors at either end) laying hen house. Tier 1 cages were at the middle of 3 tiers of 20 cages at a level of 4 feet above the ground, and Tier 2 was underneath it; the third (upper) tier of cages being left largely empty. Block 1 (cages, numbered 1-40) was to the right of the room from the main room entrance with the door opening outwards; and Block 2 cages (numbering 41-80) was to the left of the room. The experimental room was maintained at 220C and photoperiod increased by half an hour per week from an 8-hour day-length at 18 weeks of age of hens to a maximum of 15 hours per day.
Birds were fed a commercial 170 g crude protein/kg layers mash until all were in lay, with food intakes being recorded for the one week prior to their allocation into treatment groups in order to ensure that the group means did not differ greatly. Hens were also allocated to the 5 dietary groups in a completely randomised design, with 16 hens per dietary treatment, with an equal number of each treatment in each block and tier. Food intakes were recorded weekly, and all eggs were collected and weighed in a precision weighing balance. The body weights of hens were recorded individually at 0 (beginning of experimental diet feeding), 42 and 77 days.
The behaviour patterns displayed by hens were recorded as follows. For pecking, the fore finger was placed in front of the cage pointing towards the hen and the number of pecks received in following 15 seconds counted: this is described as ‘pecking at a novel object’ behaviour. It had been observed that on the approach of the experimenter some hens were deliberately starting to dig into their feeds in their hoppers, with a proportion of these hens actually feeding as if to convey some information to the experimenter; curiously, a few of these hens were also consciously brushing the back of their heads against the experimenter's hand in the enactment of this behaviour as if they were ‘asking for some decent food’. For the purposes of some reasonable statistical analysis of these data it was decided to bulk together these behaviour as simply a display of 'feeding' behaviour. On the other hand other hens were observed to be displaying a mixture of turning away from the experimenter (of even attempting to escape out of the cage), or were crouching with or without feather-fluffing. It was decided that these behaviour were the display of an 'aversion response', the term aversion being conceptualised as a fear response. The degree of severity of the display of feeding and aversion behaviour could not be quantified in any meaningful way so that for statistical purposes these were recorded in terms of their presence or absence as scores of 0 and 1.0 respectively. Since a number of hens displayed more than one behaviour pattern, a figure for 'activity' was computed by a simple summation of the scores for pecking, feeding, and aversion. In Phase1, behaviour testing was carried out on 8 occassions during the 6th week of feeding, at roughly three different times of the day (800, 1200 or 1600 hours) to determine if it was influenced by the hours of daylength that the birds were exposed to. In Phase 2, the test was carried out on 6 occassions during week 11.
The laying performance data were assessed by oneway analysis of variance, and the multiple comparison test of least significant differences was used to determine any significant differences between treatment means, using SSGS (1991). The behaviour data were analysed by factorial analysis of variance SPSS (1988). Regression and Pearsons correlation features were used in an attempt to elucidate on the causes of the behavioural response of hens.
Results
Laying performance of hens
The laying performance data are summarised in Table 3. The fresh, high-oil copra produced an initial small decline in food intake and egg production during the first week of feeding; this was followed by improvements in both parameters, although only egg output (mass of eggs laid) was similar to that of controls during the 11th week. Over the first 6 weeks (Phase 1) food intakes and egg output were significantly lower than than controls but in Phase 2 the differences were not statistically significant.
The low-oil fresh copra diet produced depressions of around 25 per cent in food intake and egg output during the first three weeks following which there was only a very minor improvement as the feeding trial progressed, that is laying performance was not significantly improved in Phase 2. The depressions in food intake and egg production were greater in the stored high-oil copra group than in the fresh low-oil copra group in both phases, but there was a significant difference in the dietary effects in that cycling in these two parameters took place at this low level of production through until the end of the feeding trial. The cycling troughs in food intake were on weeks 3, 7 and 11-12 and the peaks on weeks 5 and 9, whilst the troughs in egg output occurred in weeks 4-5 and 8-9 with peaks in weeks 6-7 and 10-11. Significantly food intake peaked and troughed more sharply, ie in particular weeks, whereas egg output peaked and troughed over a 2 week period (Figures 1 and 2).
The food intake of hens fed on the coconut oil diet was similar to controls during both phases of the experiment, but egg output was significantly lower. Food intake and egg output in the coconut oil and fresh, high-oil copra diet group were not significantly different, although towards the end of phase 2, egg output appeared to be lower in the former (Figure 2).
On average, hens in the fresh, high-oil copra group lost 86 g body weight during the first six in comparison with the 43 g gained by those in the control group; the change in body weight in phase 2 was minimal in both groups. Hens fed on the low-oil copra group had lost 463 g of body weight in Phase 1, on average, and had a small increase in body weight in Phase 2. Hens fed on the old, high oil copra diet lost 429 g of body weight in Phase 1, on average, with a further small reduction in Phase 2. Hens fed on the coconut oil diet lost some weight in Phase 1, with smaller recovery in Phase 2, but the changes were not significantly different from that of the control diet group.
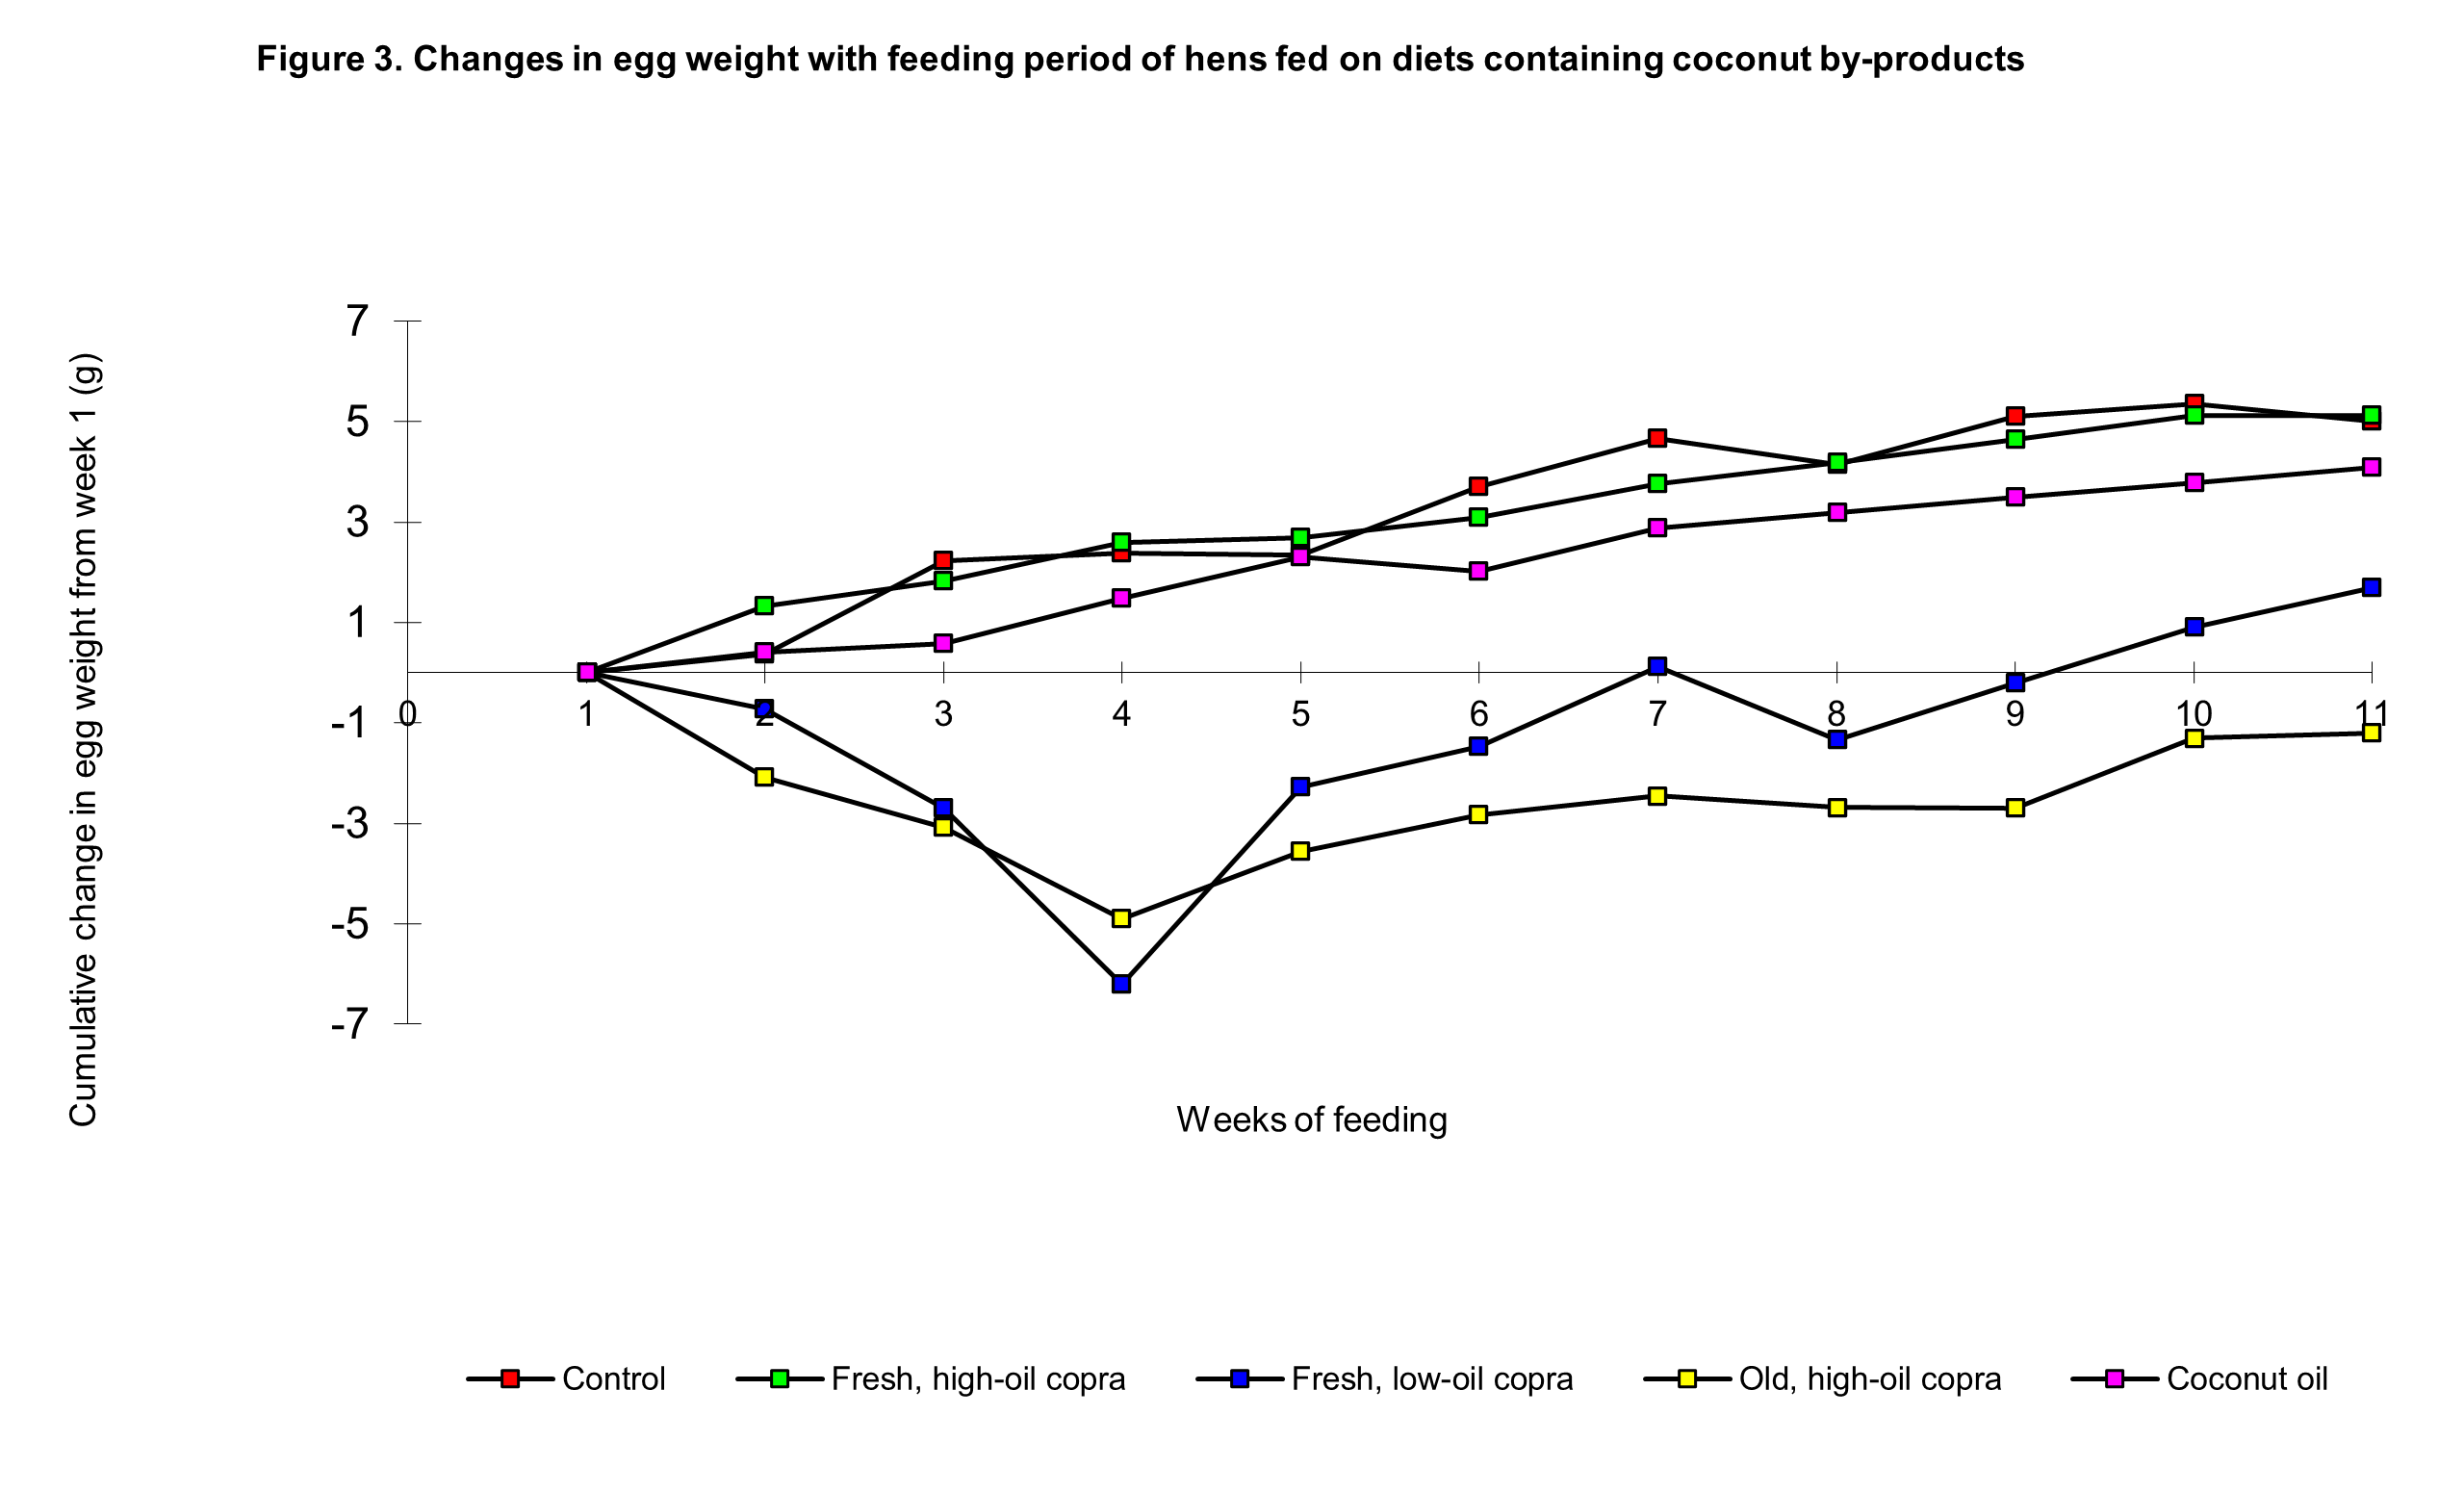
The increase in egg weights expected in newly laying pullets did not take place to the same extent in the fresh low-oil copra and the old, high oil copra groups as in the control and fresh high-oil copra groups (Figure 3); the increase in egg weights in the coconut oil diet group was also slightly lower than expected.
Behaviour changes in hens
The behaviour changes recorded are summarised in Table 4. The control diet produced a small level of activity which is taken as the baseline in order to assess the behaviour patterns displayed in the other dietary groups. It should be noted that there was an increase in pecking behaviour in the control group over time (that is in Phase 2) but not in aversive and feeding behaviour. In general hens on the higher tier also showed increased activity, particularly pecking, and there was also a block effect with block two set of cages showing increased activity.
The diet had a significant effect on pecking, feeding and aversive behaviour, all patterns being displayed to greater degree in the fresh, low-oil copra and old high oil copra groups than in the other groups. Whilst in Phase 1, the increased activity in these groups were of similar magnitude, it was distinctly higher in the low-oil copra group in Phase 2.
Pecking was not always aggressive, and ranged from minor inquisitive pecks when the beak did not even open, and which led to the occasionl very high score (up to 41 pecks recorded for one hen in a 15 seconds on one test); to viscious aggressive bites where the hen would take the finger in its beak, or pinch the skin and pull. The feeding behaviour also had peculiarities, in that many of the hens started to consume feed on spotting the experimenter approaching, but more commonly, when the finger was pointed in their direction hens would consciously brush the back of their heads and neck over the finger as they consumed feed from the hopper.
Block 2 had a greater level of activity than Block 1: this may be related to the fact that Block 1 was the side of the Room that the door opened to. Hens in Tier 1, the higher tier of cages, showed greater pecking behaviour than Tier 2 hens. Daytime had no effects on laying hen behaviour.
There were numerous two-way and three way interactions in Diet, Phase, Block and Tier as shown in Table 4 for pecking. The mean figures reveal in particular a Diet*Phase interaction to indicate that amino acid supplementation affected different diets differently in that the coconut oil diet showedmarkedly increased pecking behaviour with no deterioration in laying performance.
Discussion
Consistent with the results of previous studies (Panigrahi, 1988) hens fed on diet containing freshly expelled high-oil copra at 400 g/kg suffered a small initial decline in food intake and egg output, followed by a gradual recovery of egg output to control levels as the feeding trial progressed The results indicate that laying hens can tolerate this level of copra in their diet with satisfactory egg production results after a period of adaptation. It is alsos likely that the assumed metabolisable energy value of 16 MJ/kg for the high-oil copra, estimated by substituting the value of nitrogen free extractive*0.85 for available carbohydrates in the equation of Lodhi et al. (1976) led to an overestimation by up to 2 MJ/kg (see Panigrahi, 1991); performance is likely to be better than that obtained in this experiment if a value of 14 MJ/kg is assumed for diet formulation.
The lower level of laying performance obtained with the fresh low-oil copra diet substantiates the evidence obtained with broiler chicks (Panigrahi, 1992). The factors responsible for the lower nutritive value of this copra may be agronomic in terms of, for example, the variety of coconut, environmental conditions, or age at harvest, or due to differences in processing conditions.
The considerably poorer performance of hens fed the old, high-oil copra at 400 g/kg diet compares with a much more favourable result obtained a year previously with the same meal and using the same metabolisable energy value of 16 MJ/kg for diet formulation (Panigrahi 1989): over the 10 week experimental period, the copra had produced a similar food intake to controls with egg output being only 6 per cent lower. Unpublished results with broiler chicks have shown the same level of deterioration in nutritive value of this copra. The lowering in nutritional value is likely to have been caused by a deterioration of the fat from oxidative rancidity or mould formation and mycotoxin contamination. It is possible that palatability was reduced by oxidative rancidity or mould formation. The copra meal had developed a distinctly musty smell, and on analysis was found to contain a low level of aflatoxin (B1, B2 and G1). It is however not certain whether the aflatoxin was present before the first feeding trial in 1985 or had formed during storage during the two trials. This batch of copra contained a total aflatoxin content of 77 ppb. However, the immediate nature of the depression of food intake of 30.5 per cent in the first week and fluctuating around this intake level throughout the 11 weeks suggests that performance may have been affected by factors other than aflatoxin intake. The fat extracted from the diet used in the present study also contained very high levels of free fatty acids of 70-80 per cent (Table 2), but since this was also the case with the coconut oil diet which gave considerably better results, it is unlikely to have been the cause of the lower acceptability of the diet: a high free fatty acid level by itself does not produce major deleterious effects on laying performance.
Further, hens fed the fresh, low-oil copra meal and the old, high-oil copra meal based diets had lower efficiencies of food utilisation, and they lost body weight compared with controls. Attention was drawn to the possibility of calcium-fatty acid soap formation interactions in the intestine of chickens fed such diets in the previous paper (Panigrahi, 1989) Thus, a combination of rancidity associated fat deterioration and toxicity from fungus contamination and mycotoxin formation and greater indigestibility due to increased calcium-fat soap formation may be suggested to help explain the considerably poorer laying performance data with the old, high oil copra in comparison with the results obtained 12 months previously.
Whilst the overall food intake of hens in the old high oil copra and the fresh low-oil BOCM copra groups were not significantly different statistically and egg output was only slightly higher in the latter group, when the laying performance is examined on a weekly basis, cycling on food intake and egg output occurred with the old high oil copra but not with the latter indicating that the meal posed different nutritional problems to the hens. The possible causes of the lower nutritive value of the old stored high oil copra have already been discussed; for the low oil copra, the cause is likely to be attributable to the variety or age of cococut (older coconuts are likely to be lower in digestibility) or the high temperature single press screw press expelling employed that could have denatured a lot of the protein. There were no improvements in laying performance with additional lysine and methionine supplementation of the diet in Phase 2 although simple amino acid supplementation cannot be expected to overcome major undefined losses in protein quality or perhaps it was the digestibility of the nitrogen-free extractives that was poor in this copra. For the high-oil group too amino acid supplementation did not result in any significant improvement in laying performance. It was also noteworthy that in both these groups body weights declined to the same level, showing that hens deplete their body reserves first to try and maintain egg production to nutritional distress.
Although there are numerous reports describing various aspects of poultry behaviour, summarised by Wood-Gush (1971), the precise relationships between certain prominent features of behaviour and poultry well being are not well understood. In laying hens some behavioural traits are associated with production characteristics, with eating and standing being positively correlated and resting being negatively correlated (Webster and Hurnik, 1990). Other evidence indicates that hens that have a higher efficiency of food utilisation spend more time food pecking, walking, pacing and showing escape and aggressive behaviour than less efficient hens (Braastad and Katle, 1989). Similarly, fearfulness generally is negatively correlated with feathering and egg production (Craig, et al. 1984; Hemsworth and Barnett, 1989), and hysteria has a negative impact on production and well being (Hansen, 1976).
The present study shows clearly that changes associated with copra as a feedstuff can cause the laying hen to display behaviour patters to adverse diet in just one feed The diet had a significant effect on pecking, feeding and aversive behaviour, all patterns being displayed to greater degree in the fresh, low-oil copra and old high oil copra groups than in the other groups. Whilst in Phase 1, the increased activity in these groups were of similar magnitude, it was distinctly higher in the low-oil copra group in Phase 2. Pecking figures associated with the Diet*Phase interaction may also suggest that amino acid over-supplementation may have caused the markedly increased pecking behaviour in the coconut oil diet without a concomitant deterioration in laying performance.
The position of the cages and hens also affected behaviour markedly, Tier 1 a higher level of activity than Tier 2 due it would seem to being more bright (room equipped with ceiling lights) and closer proximity to the humans at an eye to eye level. Hemsworth and Barnett (1989) reported that birds on the top tier of a multideck battery system showed greater avoidance of an approaching experimenter, a fear response than those on bottom tier, and that this higher level of fear may have contributed to their lower productivity (Jones, 1985). In the present study Block 2 in general displaying a greater level of behavioural activity than block 1 due perhaps to the fact that block 1 was the side of the room that the door opened to so that hens developed greater anticipation of the arrival of humans into the laying hen room and interaction with humans such as the dispensing of food, cleaning of trays of excreta that took place twice a week and simply human company. The higher tier also showed greater pecking behaviour as these hens had eye to eye contact with humans whereas the lower tier hens were generally lesser sighting. These results obtained in this study should be seen as mere indicators of where future research effort on laying hen nutrition and behaviour needs to be focused in relation to coconut by-products as a dietary ingredient.
Aversion appears to decline generally with the period of feeding. Whereas for pecking the low-oil BOCM caused an increase in pecking behaviour as the feeding trial progressed, there was no real increase in pecking in the high oil copra group when taking the natural increase in pecking behaviour over the period of the trial is also considered. This adds to the suggestion that different diets induce different types of behaviour; if the high-oil copra was toxic it may help explain the differences in pecking behaviour observed. Pecking activity shows a sign of birds in good health and condition simply demanding a better nutritional diet.
The study of Webster and Hurnik (1990) has shown that the dam parental stock had signficant heritability estimates for certain behaviour such as eating, standing cage pecking, physical displacement which were positively associated with egg production. Feather pecking and other measures of aggression also had fairly large heritability estimates.
Aggression is a common response to frustration (Duncan, 1971). Any specialised adaptive modifiability of behaviour can never be a product of chances and hgas to be regarded as the function of a nervous apparatus whcih is highly organised and which owes its origin as all organisation does to the process of `pure induction' conducted by the evolution of the species (Lorenz, 1966).
Adaptation is the process which moulds the organism so that it fits its environment in a way achieving survival' (Lorenz, 1966) In promoting the concept of all behaviour being 'innate' he suggested that a special releasing mechanism may achieve the recognition of a needed chemical: birds lacking calcium will peck at and eat anything white, hard and crumbling substance, regardless of chemical compostion, obviously guided by visual and tactile stimuli rather than chemical ones: such powerful is this that birds could poison themselves by eating carbide.
Giving the example of many omnivorous animals having a mechanism that causes them to prefer food with a minimum content of fibre and a maximum content of sugar, fat and starch, Lorenz (1966) suggests that whereas in 'normal' conditions of wild life, this phylogenetically (evolutionary pedigree or genealogical history; phylon=race, genesis= origin) adapted releasing mechanism is of obvious survival value, in civilised man it gives rise to a search for super normal objects, the addiction to which actually amounts to a vice detrimental to health (eg white bread, chocolate, etc causing constipation, obesity, tooth decay, etc) In closely analogous manner, another important teaching mechanism can miscarry, ie a mechanism that acts on the generally reliable ''hypothesis'' that a situation affording relief of tension is also one desirable in the interest of survival. However, the limited probability of a behaviour mechanism thus miscarrying is no threat to the survival of the species, and it is still less of an argument against the well-based assumption that the mechanism in question is, under normal circumstances of great survival value.
That 'learning' enters into every phylogenetically adapted behaviour mechanism is neither a logical necessity nor supported by observational and experimenatal facts (eg unconditioned reflexes). The hit-and-miss method of mutation and selection gains only by its successes and not by its failures, and continues blindly to produce those mutants that have proved unsuccessful millions of years ago.
The computing mechanisms that enable a starling to deduce the points of the compass form the motion of the sun across the sky (a sun that the bird has never seen before), the complex feedback mechanisms that enable a mantid to aim its grabbing movement unerringly at the prey, the unvarying inherited courship movement of a drake which releases a specific answer in a duck of the same species, the internal clock which prescribes rhythmical recurrence of activities in so many animals, all optomotor responses, and so on are all ''nervous processes or mechanisms which are different from those into which learning enters''.
Truly 'new' learned movements can evidently be developed by only a very few animals. Assuming that fixed motor pattern (called 'innate') can be changed by learning is not based on any observation or expeirmental result, but exclusively on a prejudice and does do real damage if modern ethologists really drag the last bitter consequences from it.
There is no evidence and no logical reason for assuming that all phylogenetically adapted machinery of behaviour must unconditionally be susceptible to adaptive modification. Quite the contrary, there are strong arguments in favour of the assumption that certain mechanisms of behaviour, for the simple reason that they do contain the phylogenetic programming of learning process, must themselves be refractory to any modificatory change. No biologist treats the concepts of phylogenetically adapted and adaptively modified organs or behaviou patterns as being mutually exclusive. This dichotomy would indeed be fallacious but in a sense directly opposed to the one implied by Hebb: phylogenetic adaptation must unconditionally be contained in every learning process, while the hyothesis that learning must enter into all phylogenetically adapted behvaiour is entirely unfounded.
Animal behaviour is generally considered adaptive in function, ensuring the well being and/or survival of the animal, and modifications in behaviour to cope with stress factors in the environment might be expected to operate through complex phylogenetic and learned processess. Lorenz (1966) argued strongly against the proposition that 'innate' and 'learned' behaviour represented two extremes of a continuum of gradation in which all possible mixtures and blendings of the two sources of adaptation are found, and that all behaviour owes its adaptedness to both these processes. There are two independent mechanisms that affect adaptation of behaviour: the process of phylogeny which evolves behaviour as well as other structural and functional organisation, and the process of adaptive modification of behaviour during the individual's life. Whilst the genetic basis of behaviour is not in question, there is doubt as to whether a change in behavior is purposefully adaptive derived from phylogenetic processes, and is there an element of trial and error that could signify a learning process.
An important question is whether abnormal behaviour of the type observed in this study is adaptive in that it may assist the bird in meeting it's nutritional requirements, or is an expression of frustration arising from nutrient deprivation (Duncan and Wood-Gush, 1972). A common feature of the behaviour pattern is an increased awareness of the environment, which together with the act of turning over the feed may increase the chances of locating the nutrient in a natural situation, and could, therefore, be considered adaptive. However, some other acts observed in this and other studies appear too stereotyped to be investigative, and seem purposeless in a caged environment. For example, laying hens may display various types of behaviour (pecking, being the most common, feeding, aversion, etc) in response to a nutritional problem, with pecking itself ranging from gentle pecks, in which the beak does not open, to vigorous ones and even viscious bites (S. Panigrahi, unpublished personal observation). Whilst Kare and Maller (1967) have shown that diet can influence taste preferences and birds fed a calori-diluted diet selected a 10% sucrose solution in preference to water when they had previously selected indifferently under ad libitum feeding with normal diet. The lack of a post-ingestional feedback in chicks displaying abnormal behaviour but unable to select a sodium-supplemented diet after a period of sodium deprivation (Hughes and Whitehead, 1979), may also question whether the behavioural response has an adaptive function. The gradual waning of the behaviour pattern as chicks adapted physiologically to a copra-based diet (Panigrahi et al. 1987) may further indicate that the behavioural response is an expression of a deprived state or frustration.
Wood-Gush (1971) suggested that pecking objects in response to a nutritional deficiency may be highly adaptive in that gustatory expoloration of this sort may lead the animal to a food source that can supply its needs. Wald and Jackson (1944) in reporting that nutritional deprivation caused increased activity (running) in rats, activity appeared futile in the confines of a particular situation. They further commented: 'activity is the primary response of deprivation, regardless of sensation and external inducements. However, if the environment offers the possibility, sensory and cortical mechanisms superimposed on the primarty reactionmay guide it to appropriate chemicals. Otherwise the response remains confined to simple hyperactivity. In free environment, running should fulfill an important function, since it increases the probability that the animal will encounter what it lacks. In effect it represents a gamble in which the animals metabolic reserves are staked against the chance of finding its necessities. The possibility of a successful outcome for the individual is however not the only point of this reaction. It probably also represents the behaviourla basis of mammalian emigration, which is recognised to be motivated by nutritional need. For the individual, it takes the form of aimless and persistent wandering. Its essential biological function is not to rescue the emigrating animal - though this may occur - but to relieve nutritional pressure on the home population.
Acknowledgement
The author is grateful to Mr John Gibbs for aflatoxin analysis of copra meals, Ms Juliet Bainton for amino acid analysis of diets, and Mr Jim Martin for free fatty acid analysis of diets during the experimental work that was conducted while the author was employed at the Overseas Development Natural Resources Institute (Department of Overseas Development, Government of the United Kingdom), Culham, Oxfordshire OX14 3DA.
References
Bearse G.E., Miller V.L. and McClary C.F. The cannibalism preventing properties of the fibre fraction of oats. Poultry Science, 17: 210-215. 1940.
Braastad B.O. and Katle J. Behavioural differences between laying hen populations selected for high and low efficiency of food utilisation. British Poultry Science, 30: 533-544. 1989.
Broom D.M. Indicators relavant to farm animal welfare. D Smidt, ed. Martinus Nijhoff Publishers, Boston, MA USA. 1983. «In: Stereotypes as animal behaviour indicators.
BSI Determination of acidity.British Standards Institution 2 Park Street, London W1A 2BS. 1976. In : Method BS 684. British Standards Methods of analysis of fats and fatty oils. Part 2. In : Other methods Section 2.10
Craig J.V., Kujiyat S.K. and Dayton, A.D. Tonic immobility responses of White Leghorn hens affected by induction techniques and genetic stock differences. Poultry Sciece, 63: 1-10. 1984.
Creek, R.D. and Dendy M.Y. The relationship of cannibalism and methionine. Poultry Science, 36: 1093-1094. 1957.
Duncan I.J.H. and Wood-Gush D.G.M. Frustration and aggression in the domestic fowl. Animal Behaviour, 19: 500-504.1971.
Duncan I.J.H. and Wood-Gush D.G.M. Thwarting of feeding behaviour in the domestic fowl. Animal Behaviour, 20: 444-451. 1972.
Hansen R.S. Nervousness and hysteria of mature female chickens. Poultry Science, 55: 531-543. 1976.
Hebb D.O. Heredity and Environment in Mammalian Behaviour. British Journal of Animal Behaviour, 1: 43-47. 1953.
Hemsworth P.H. and Barnet J.L. Relationships between fear of humans, productivity and cage position of laying hens. British Poultry Science, 30: 505-518. 1989.
Hughes B.O and Wood-Gush D.G.M. An increase in activity of the domestic fowl produced by nutritional deficiency. Animal Behaviour, 21: 10-17. 1973.
Hughes B.O. and Whitehead C.C. Behavioural changes associated with the feeding of low-sodium diets to laying hens. Applied Animal Ethology, 5: 255-266. 1979.
Jones R.B. Fearfulness of hens caged individually or in groups in different tiers of a battery, and the effects of translocation between tiers. British Poultry Science, 26: 399-408. 1985.
Kare M.R. and Maller O. Taste and food intake in domesticated jungle fowl. Journal of Nutrition, 92: 191-196. 1967.
Lodhi G.N. Singh D. and Ichhponani J.S. Variation in nutrient content of feeding stuffs rich in protein and reassessment of the chemical method for metabolisable energy estimation for poultry. Journal of Agricultural Science (Cambridge), 86: 293-303. 1976.
Lorenz K. Metheun and Co Ltd. 1966. In : Evolution and modification of behaviour.
MAFF. The Analysis of Agricultural Materials. A manual of the analytical methods used by the Agricultural Development and Advisory Service. Ministry of Agriculture Fisheries and Food. Her Majesty's Stationary Office, Holborn, London. 1986. In: Reference Book 427.
Miller M.W. and Bearse G.E. The cannibalism preventing properties of oat hulls. Poultry Science, 17: 466-471. 1938.
Panigrahi S. Machin D.H. Parr W.H. and Bainton J. Responses of broiler chicks to dietary copra cake of high residual lipid content. British Poultry Science, 28: 589-600. 1987.
Panigrahi S. Effects on egg production of including high residual lipid copra meal in laying hen diets. British Poultry Science, 30: 305-312. 1989.
Panigrahi S. 1991. Behaviour changes in broiler chicks fed on diets containing palm kernel meal. Applied Animal Behaviour Science, 31: 277-281.
Panigrahi S. Effects of different copra meals and amino acid supplementation on broiler chick growth. British Poultry Science, 33: 675-680. 1992.
SPSS In : SPSS/PC+ V20 Base Manual for IBM PC/XT/AT and PS2. SPSS Inc. 444 North Michigan Avenue, Chicago, Illinois 60611. USA. 1988.
SSGS Statgraphics Statistical Graphics System. Version 5. STSC Inc, 2115 East Jefferson Street, Rockville, Maryland 20852, USA. 1991.
Schaible P.J. Davidson J.A. and Bandemer S.L. Cannibalism and feather picking in chicks as influenced by certain changes in a specific ration. Poultry Science, 26: 651-656. 1947.
Siegel P.B. Behaviour genetics in chickens: a review. Worlds Poultry Science Journal, 35: 9-19. 1979.
Siren, M.J. A factor preventing cannibalism in cockerels. Life Science, 2: 120-124. 1963.
Coker R.D. Jones B.D. Nagler M.J. Gilman G.A. Wallbridge A.J. and Panigrahi S. In : The Mycotoxins Training Manual, Tropical Development and Research Institute, Central Avenue, Chatham Maritime, Kent ME8 0SL.1984.
Wald G. and Jackson B. Activity and Nutritional Deprivation. In: Proceedings of the National Academy of Science, USA, 30: 255-263. 1944.
Watson I.G. and Bennet C.J. Feed survey in the Philippines. Feed Compounder. 1992.
Webster A.B. and Hurnik J.F. Behaviour, production and well being of the laying hen. 2. Individual variation and relationships of behaviour to production and physical condition. Poultry Science 70: 421-428. 1990.
Wood-Gush, D.G.M. and Kare, M.R. The behaviour of calcium-deficient chickens. British Poultry Science, 7:285-290. 1966.
Wood-Gush, D.G.M. The behaviour of the domestic fowl. . Heinemann Educational books Ltd: London. 1971
LIST OF TABLES
Table 1. Proximate composition of the copra meals
Fresh,
high-oil Fresh, low-oil Old, high-oil copra copra
copra
Dry matter 971.4 895.7 920.0
Crude protein 172.6 205.0 229.3
Crude fibre 103.9 104.6 76.5
Crude fat 205.0 75.0 220.9
Ash 52.0 51.9 76.5
Metabolisable energy (MJ/kg)1 15.00 12.38 16.00
Lysine 6.9 0.7 6.9
Methionine+cystine 7.1 7.8 7.1
Aflatoxin B12 3.0 1.7 56.7
Aflatoxin B2 0.4 0.2 3.3
Aflatoxin G1 0.8 0.8 16.8
_____________________________________________________________________
Note: 1 - the values used to formulate the diets. 2 - determined using HPTLC Bond Elut method (Coker et al, 1994)
Table 2. Composition of the experimental diets (g/kg)
Treatment Groups Control Fresh, high-oil Fresh, low-oil Old,
high-oil Coconut oil
(1) copra (2) copra (3) copra
(4) (5)
____________________________________________________________________________________________
Diet ingredients:
Copra meal - 400.00 400.00 400.00 -
Fishmeal 50.00 - - - -
Maize 566.7 180.53 260.54 62.55 -
Soyabean 148.34 165.79 96.38 12.90 169.34
Cassava - - - 100.00 82.35
Wheatfeed - 83.34 - 195.27 230.00
Dicalcium phosphate 13.89 15.93 16.66 8.21 7.57
Limestone 74.83 85.35 85.77 90.70 87.95
Vitamin/mineral premix1 3.00 3.00 3.00 3.00 3.00
Salt 1.37 0.83 - - 1.08
Molasses 50.00 50.00 5.40 21.88 80.00
Lysine 0.41 1.10 4.79 5.09 1.54
Methionine 0.89 0.75 0.78 2.01 1.69
Maize oil 3.53 - 34.87 - -
Coconut oil - - - - 100.00
Sunflower meal 87.04 13.38 91.81 98.39 144.57
Maize gluten feed - - - - 90.91
Analyses:
Moisture 116.3 85.8 91.3 100.1 90.8
Crude protein 183.0 179.8 188.5 177.9 192.6
Crude fat 33.8 91.3 84.7 91.7 104.8
Crude fibre 58.8 76.9 81.7 78.5 83.2
Ash 125.4 126.7 135.2 158.8 143.3
Calcium 38.8 36.9 40.8 41.8 39.0
Phosphorus 7.2 6.9 7.0 6.9 7.1
Salt 3.9 6.6 5.9 5.9 4.4
Metabolisable energy (MJ/kg) 11.6 11.8 11.8 11.8 12.00
Free fatty acids in extracted
oil (% as lauric acid)2 23.3 12.7 15.9 73.3 77.1
Amino acids:
Aspartic acid 1.34 1.39 1.37 1.16 1.55
Threonine 0.57 0.52 0.53 0.47 0.60
Serine 0.72 0.70 0.69 0.61 0.76
Glutamic acid 2.52 2.77 2.86 2.66 3.19
Proline 0.84 0.78 0.80 0.71 0.92
Glycine 0.75 0.71 0.73 0.72 0.83
Alanine 0.83 0.72 0.73 0.65 0.77
Cystine 0.33 0.32 0.33 0.40 0.36
Valine 0.77 0.52 0.54 0.52 0.81
Methionine 0.29 0.29 0.33 0.41 0.40
Isoleucine 0.57 0.54 0.55 0.48 0.64
Leucine 1.25 1.00 1.03 0.84 1.10
Tyrosine 0.51 0.48 0.48 0.39 0.55
Phenylalanine 0.69 0.65 0.65 0.58 0.73
Histidine 0.46 0.47 0.48 0.44 0.50
Lysine 0.73 0.71 0.85 0.71 0.79
Arginine 0.91 1.37 1.43 1.32 1.20
____________________________________________________________________________________________
1. For the composition of the premix see Panigrahi (1989). 2 - BSI (1976)
Table 3. Laying performance of hens fed on diets containing coconut by-products.
Dietary groups Control Fresh, high-oil Fresh, low-oil Old,
high-oil Coconut oil SEM Significance
(1) copra (2) copra (3) copra
(4) (5) (P=)
________________________________________________________________________________________________________________________
Phase 1 (1-6 weeks):
Food intake
(g/hen/day) 124.5a 117.1a 82.6b 79.8b 127.1ac 3.34 0.0001
Number eggs/hen d 0.93a 0.87a 0.52b 0.42c 0.89 a 0.025 0.0001
G eggs/hen d 54.7a 49.8b 27.8c 22.9d 48.9b 1.60 0.0001
Mean egg weights 59.0a 57.2a 53.5b 54.2b 55.3ab 1.15 0.0062
G eggs/kg feed 441a 425a 341b 292c 389d 15.1 0.0001
Number of eggs/kg feed 7.48a 7.43a 6.41b 5.39c 7.01bd 0.26 0.0001
Phase 2 (7-11 weeks):
Food intake
(g/hen/day) 129.3a 124.4a 91.8b 84.4b 124.8a 3.01 0.0001
Number of eggs/hen d 0.89a 0.89a 0.38b 0.25c 0.85a 0.025 0.0001
G eggs/hen d 55.4a 52.9ad 20.6b 13.7c 50.1d 1.59 0.0001
Mean egg weights 61.8a 59.8a 55.2b 54.4b 59.2a 1.08 0.0001
G eggs/kg feed 427
a 425a 227b 162c 402a 12.0 0.0001
Number of eggs/kg feed 6.91a 7.14a 4.16b 2.98c 6.82a 0.22 0.0001
Body weight changes(g):
Initial body weight (0 d) 1850 a 1887a 1878a 1876 a 1954a 43.9 0.5419
Body weight at 42 days 1893ac 1801c 1415b 1447b 1944a 44.1 0.0001
Body weight at 77 days 1898ac 1806c 1437b 1431b 1953a 46.8 0.0001
Change during 0-42 d 43
a -86b -463c -429c -10a 31.4 0.0001
Change during 42-77 d 5 a 5 a 22a -16 a 9a 20.8 0.7993
Change during 0-77 d 48
a -81b -441c -444c -1a 34.4 0.0001
________________________________________________________________________________________________________________________
Note: SEM - pooled standard error of means; error degrees of freedom - 75; Diet
effects: values in the same horizontal line with different superscripts are
significantly different (P<0.05)
Table 4. Behaviour of laying hens in response to diets containing coconut by-products.
Dietary treatments Control Fresh, high-oil
copra Fresh, low-oil copra Old, high-oil copra Coconut
oil
Daytime (hours) 800 1200 1600 800 1200 1600 800 1200 1600 800 1200 1600 800 1200 1600
Phase 1:week 6:
Number of
observations1 32 64 32 32 64 32 32 64 32 32 64 32 32 64 32
Pecking 0.25 0.52 0.78 1.38 1.14 1.94 2.66 2.34 3.16 2.16 2.47 2.97 0.56 0.59 0.50
(4) (7) (7) (6) (8) (6) (11) (11) (12) (11) (11) (11) (10) (9) (5)
Feeding 0.00 0.00 0.00 0.00 0.03 0.03 0.03 0.03 0.16 0.09 0.08 0.25 0.03 0.00 0.06
(0) (0) (0) (0) (1) (1) (1) (1) (4) (3) (2) (5) (1) (0) (2)
Aversion 0.09 0.06 0.00 0.03 0.06 0.03 0.06 0.13 0.09 0.09 0.11 0.03 0.03 0.03 0.00
(2) (3) (0) (1) (2) (1) (3) (5) (2) (3) (6) (1) (1) (2) (0)
Activity 0.34 0.58 0.78 1.41 1.23 2.00 2.75 2.50 3.41 2.34 2.67 3.25 0.63 0.63 0.56
(6) (9) (7) (7) (11) (8) (13) (14) (14) (14) (14) (13) (11) (11) (7)
Phase 2: week 11:
Number of
observations1 32 48 16 32 48 16 32 48 16 32 48 16 32 48 16
Pecking 1.38 0.96 0.44 1.25 2.06 0.63 6.06 4.98 4.75 3.47 3.19 2.06 2.69 2.52 0.50
(6) (8) (3) (9) (8) (1) (12) (14) (10) (12) (10) (11) (9) (12) (5)
Feeding 0.00 0.00 0.00 0.00 0.04 0.06 0.19 0.29 0.19 0.31 0.35 0.25 0.06 0.08 0.06
(0) (0) (0) (0) (1) (1) (4) (4) (3) (4) (8) (4) (2) (3) (1)
Aversion 0.03 0.02 0.00 0.00 0.00 0.00 0.03 0.00 0.00 0.06 0.06 0.00 0.00 0.00 0.00
(1) (1) (0) (0) (0) (0) (1) (0) (1) (2) (1) (0) (0) (0) (0)
Activity 1.41 0.98 0.44 1.25 2.10 0.69 6.28 5.27 4.94 3.84 3.60 2.31 2.75 2.60 0.56
(7) (9) (3) (9) (8) (2) (14) (15) (13) (14) (14) (13) (9) (12) (5)
____________________________________________________________________________________________________________________________________
1. In multiples of 16 hens per diet. Figures in brackets are the number out of
16 hens displaying a behaviour.
Analysis of variance: Four and five way interactions
were suppressed and the sums of squares for these interactions pooled into the
error sums of squares. Residual degrees of freedom - 1037; total degrees of
freedom - 1119.
Table 5. Analysis of
variance of laying hen behaviour: significance of F (P=).
Pecking Feeding Aversion Activity
Covariate:
Initial body weight 0.0760 0.0350 0.6270 0.0490
Main effects:
Diet 0.0001 0.0001 0.0080 0.0001
Daytime 0.8100 0.1290 0.0620 0.8410
Phase 0.0001 0.0001 0.0001 0.0001
Block 0.0040 0.0680 0.7240 0.0050
Tier 0.0001 0.5720 0.0001 0.0001
Two-way interactions:
Diet*Phase 0.0020 0.0001 0.4790 0.0010
Diet*Block 0.7220 0.0001 0.0390 0.7440
Diet*Tier 0.0001 0.0001 0.0130 0.0001
Daytime*Phase 0.0150 0.0350 0.5380 0.0090
Phase*Tier 0.0830 0.5500 0.0850 0.1070
Block*Tier 0.0001 0.0001 0.0020 0.0001
Three-way interactions:
Diet*Phase*Block 0.0010 0.0030 0.2790 0.0020
Diet*Phase*Tier 0.0001 0.0001 0.5870 0.0001
Diet*Block*Tier 0.0010 0.0001 0.0560 0.0030
Residual mean square error 13.428 0.075 0.039 13.208
________________________________________________________________________
Table 6. Means in main effects for pecking behaviour:
[Categories within variable: Diets: 1 - Control, 2-Fresh,high-oil copra, 3 - Fresh, low-oil copra, 4 -Old, high-oil copra, 5- Coconut oil; Daytime: 1 - 800 hours, 2 - 1200 hours, 3 - 1600 hours; Phase: 1 - weeks 1-6, 2 - weeks 7-11; Tier: 1 - Upper (about 4 feet above ground) , Lower (about 2 feet above ground); Block: 1 Right side of room, 2 - Left side of room (door opens to this block). The number of cases are shown in brackets]
Category within variable: 1 2 3 4 5
Pecking behaviour:
Diet 0.73
(224) 1.46 (224) 3.77 (224) 2.76
(224) 1.28 (224)
Daytime 2.18
(320) 1.98 (560) 1.80 (240)
Period 1.52
(640) 2.64 (480)
Block 1.70
(560) 2.31 (560)
Tier 2.44
(560) 1.56 (560)
Some important means in two-way
interactions for pecking behaviour (the number of cases are shown in
brackets):
(a)
Diet*Phase (b) Diet*Block (c) Diet*Tier
Phase Block Tier
Diet 1
(160) 2 (96) 1 (112) 2
(112) 1 (112) 2 (112)
1 0.52 1.01 0.54 0.92 0.96 0.50
2 1.40 1.55 1.11 1.82 2.26 0.67
3 2.63 5.30 3.67 3.88 3.21 4.34
4 2.52 3.09 2.32 3.21 3.97 1.55
5 0.56 2.24 0.86 1.71 1.80 0.76
Significance (P=) 0.0020 0.7220 0.0001
(d) Daytime*Phase
Phase
Daytime 1 2
1 1.40
(160) 2.97 (160)
2 1.41
(320) 2.74 (240)
3 1.87
(160) 1.68 (80)
Significance (P=) 0.0150
(e) Block*Tier
Tier
Block 1 2
1 1.71
(280) 1.69 (280)
2 3.17
(280) 1.44 (280)
Significance (P=) 0.0001
Pearsons correlation:
. Body weight Weight loss Food intake Egg
output
Pecking -0.22** 0.29** -0.26** -0.26**
Feeding -0.15** 0.21** -0.22** -0.27**
Aversion -0.06 0.08* -0.06 -0.07
Activity -0.24** 0.31** -0.29** -0.28**
Number of cases: 1120; 1-tailed significance: * - P<0.01, ** - P<0.001
Table 7. A summary of
two-way and three-way interactions in the behaviour of hens in the feeding
trial
Feeding Pecking Aversion Activity
Two-way interactions:
Diet*Period y y n y
Diet*Block y n y n
Diet*Tier y y y y
Daytime*Period y y n y
Period*Tier n y y n
Block*Tier y y y y
Three-way interactions:
Diet*Period*Block y y n n
Diet*Period*Tier y y n y
Diet*Block*Tier y y y y